Browsing MyoMiner
Select a category of interest: All categories are visible at the beginning, so that the user can find with ease what is available on MyoMiner. By clicking on a category only the options that are related with this category will remain visible. This way the user is guided to the available MyoMiner category.
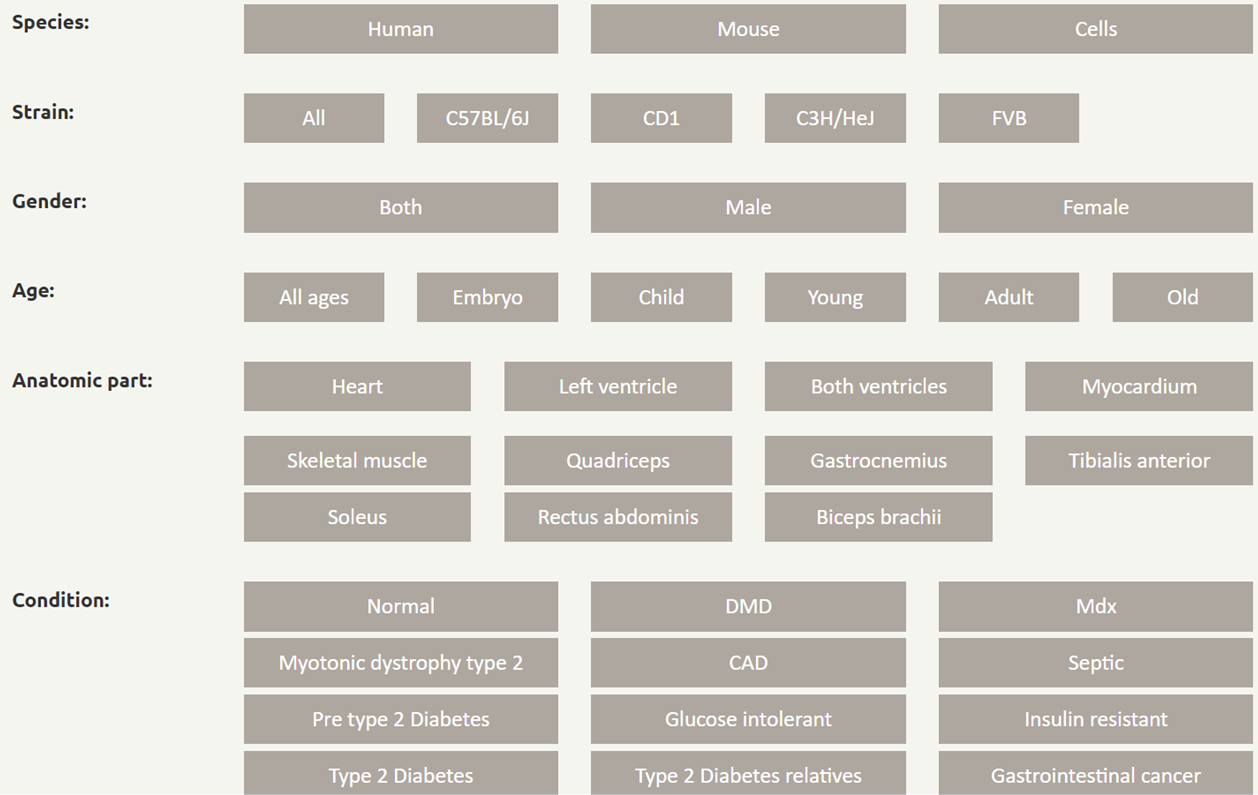
Table output: Search by gene symbol, Ensembl or Entrez gene ID. All transcriptional co-expressions of any expressed gene-pair displayed when hitting submit. The first column is the paired gene symbol, the second is the annotation of the paired gene, the third is the Sprearman’s correlation of that pair, the fourth and fifth are the BH FDR adjusted p-value and the confidence intervals. The table can be downloaded in CSV format or copied directly to the clipboard.

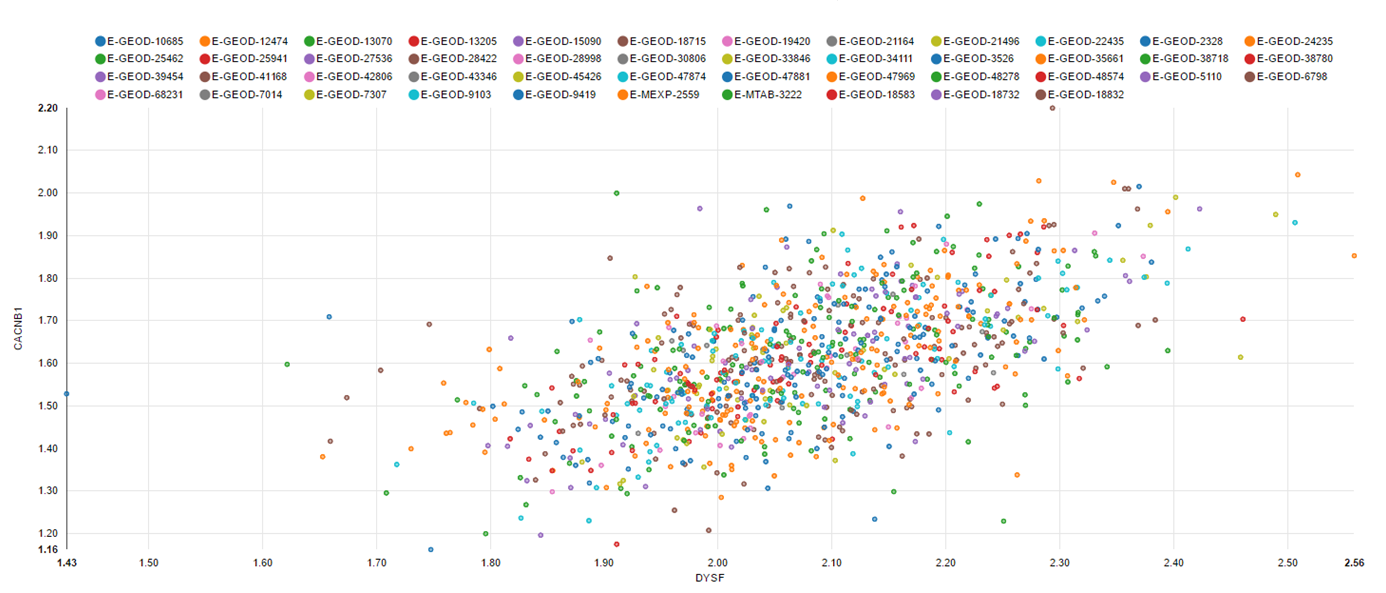
Interactive gene pair scatterplot: The expression values of every sample of the selected category for that gene pair are plotted by clicking on the r value. Each series is shown at the top and can be toggled to display the expression values for any series independently.
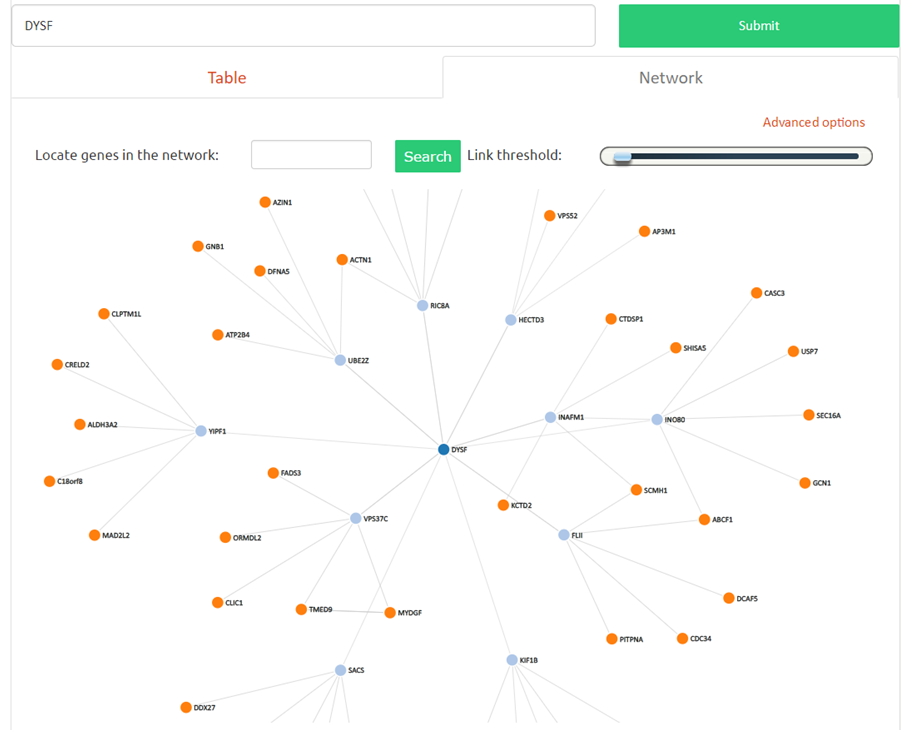
Interactive co-expression network: The network is constructed based on gene correlation. Users can change the number of relations or set a correlation threshold from the advanced options.
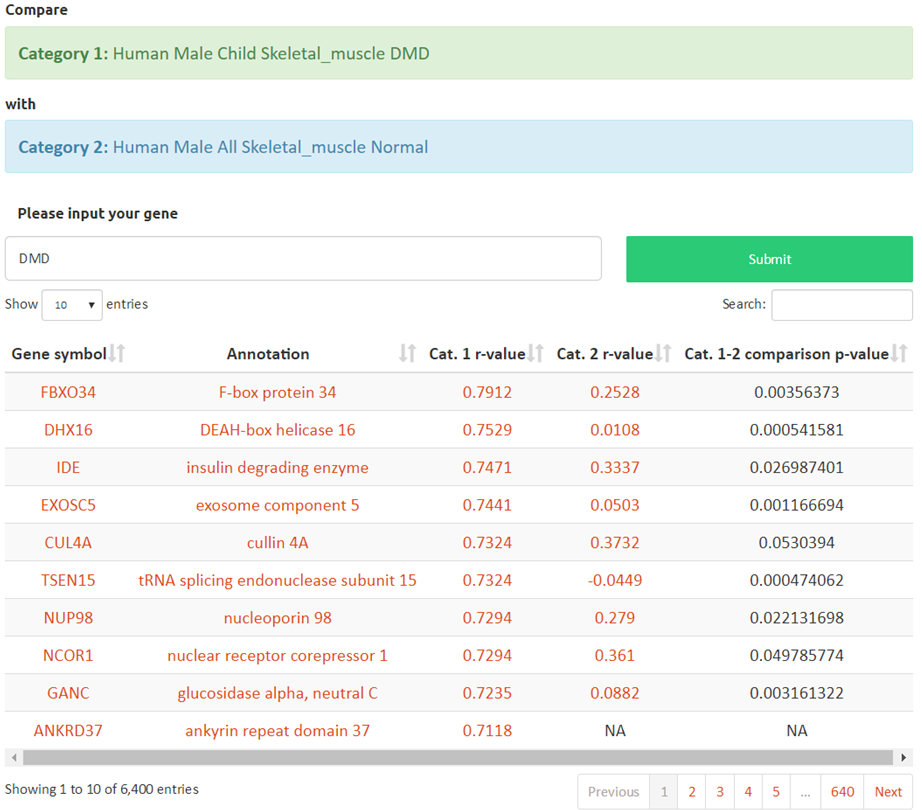
Differential co-expression analysis" Select two or more categories and compare the first to the rest. A gene may be a regulator if its co-expression is significantly altered (p-value) between pathological conditions.
What is MyoMiner
MyoMiner is the first striated muscle cell- and tissue-specific database that provides co-expression analyses in both normal and pathological tissues, addressing both issues of overall correlation and batch effects. It includes 1,810 mouse and 1,155 human microarray samples separated in 142 human, mouse and cell categories based on age, sex, anatomic part and condition. A simple and easy-to-use web interface is provided to search for transcriptional co-expression of any expressed gene pair in muscle cells/tissues and the various pathological conditions. Users can select a category and a gene of interest, and MyoMiner will return all the expressed correlated genes for that category. Correlation strength is measured by the provided FDR adjusted p-value (q-value) and Confidence Intervals for each correlation.
Raw data collection
Even though ArrayExpress mirrors Gene Expression Omnibus, we searched both repositories for striated muscle (skeletal and cardiac), cells and cell line experiments. In this initial screening we found that the most abundant microarray chips used for muscle related experiments were Affymetrix Human Genome U133 Plus 2.0 GeneChip (GEO platform GPL570 or ArrayExpress ID A-AFFY-44) for human and Affymetrix Mouse Genome 430 2.0 GeneChip (GEO platform GPL1261 or ArrayExpress ID A-AFFY-45) for murine samples. Since a correlation analysis requires very homogenous data, we limited our more refined subsequent searches to these two platforms, which represent about 50 % of all muscle arrays on both repositories.
We searched ArrayExpress using the following string: (muscle(s) OR myoblast(s) OR myotube(s) OR myofiber(s) OR cardiomyocyte(s) OR myocyte(s) OR heart(s) OR HSMM) AND A-AFFY-44 for human samples and (muscle(s) OR myoblast(s) OR myotube(s) OR myofiber(s) OR cardiomyocyte(s) OR myocyte(s) OR heart(s) OR C2C12 OR HL1 OR G8 OR SOL8) AND A-AFFY-45 for murine samples. GEO and ArrayExpress assign a different ID (GPL) to each alternative platform. An alternative platform uses the same chip as the original but pre-processed with a different probe-to-gene mapping file called Chip Description File (CDF). It is quite popular for researchers to use a different CDF than the original for better probe-to-probeset and probeset-to-gene targeting accuracy (see “Probes to gene mapping” section). GEO provides a list of alternative platforms in the original platform GPL, but is not well maintained and many are missing. A better way to identify them is to search on ArrayExpress (which is manually curated) for alternative IDs. In the browse page of ArrayExpress* we searched for U133 Plus 2.0, MG 430 2.0 and retrieved all the alternative GEO platforms and IDs to A-AFFY-44 (GPL570) for human and to A-AFFY-45 (GPL1261) for mouse.
We also parsed their MIAME (Brazma, Hingamp et al. 2001) metadata and confirmed them manually, selecting only those pertinent to muscle research. We excluded all series that did not include the raw CEL files (Affymetrix fluorescence light intensity files), as we pre-processed the CEL files using the robust data analysis pipeline described in detail below, in order to homogenize the data as much as possible.
Data pre-processing
Pre-processing algorithms, usually termed normalization algorithms, are three-step processes: background correction, normalization and probe summarization. The arrays that passed quality controls were pre-processed with the Single Channel Array Normalization (SCAN) algorithm (Piccolo, Sun et al. 2012) with default parameters except for the CDFs, which were downloaded from BrainArray ENSG version 20.0.0 (Dai, Wang et al. 2005). SCAN normalizes each array independently from its series, corrects GC bias and reduces probe and array variation from each individual sample, while increasing signal-to-noise ratio. Single array normalization is preferred when combining microarray samples from different series or laboratories, because other pre-processing algorithms such as RMA (Irizarry, Hobbs et al. 2003) or GC-RMA (Zhijin Wu 2004) use information across samples for both normalization and summarization steps, and could introduce correlation artifacts (Lim, Wang et al. 2007; Usadel, Obayashi et al. 2009).
References
Brazma, A., P. Hingamp, et al. (2001). "Minimum information about a microarray experiment (MIAME)-toward standards for microarray data." Nat Genet 29(4): 365-371.
Piccolo, S. R., Y. Sun, et al. (2012). "A single-sample microarray normalization method to facilitate personalized-medicine workflows." Genomics 100(6): 337-344.
Dai, M., P. Wang, et al. (2005). "Evolving gene/transcript definitions significantly alter the interpretation of GeneChip data." Nucleic Acids Res 33(20): e175.
Irizarry, R. A., B. Hobbs, et al. (2003). "Exploration, normalization, and summaries of high density oligonucleotide array probe level data." Biostatistics 4(2): 249-264.
Zhijin Wu , R. A. I., Robert Gentleman , Francisco Martinez-Murillo (2004). "A Model-Based Background Adjustment for Oligonucleotide Expression Arrays." Forrest Spencer Journal of the American Statistical Association 99.
Lim, W. K., K. Wang, et al. (2007). "Comparative analysis of microarray normalization procedures: effects on reverse engineering gene networks." Bioinformatics 23(13): i282-288.
Usadel, B., T. Obayashi, et al. (2009). "Co-expression tools for plant biology: opportunities for hypothesis generation and caveats." Plant Cell Environ 32(12): 1633-1651.